Feb 29, 2012

SSPP: Aesthetic Approach


Through user-testing and consultation with faculty it has been determined that the visual aesthetic of my final project and accompanying collateral will be a hybrid of traditional illustration and computer-generated design. In the midst of deciding how to present the final information, I was consistently advised to use my illustrative background as a way to display a unique outlook on information-based graphics. More in particular, the way I develop concept and ideas using sketchbooks.

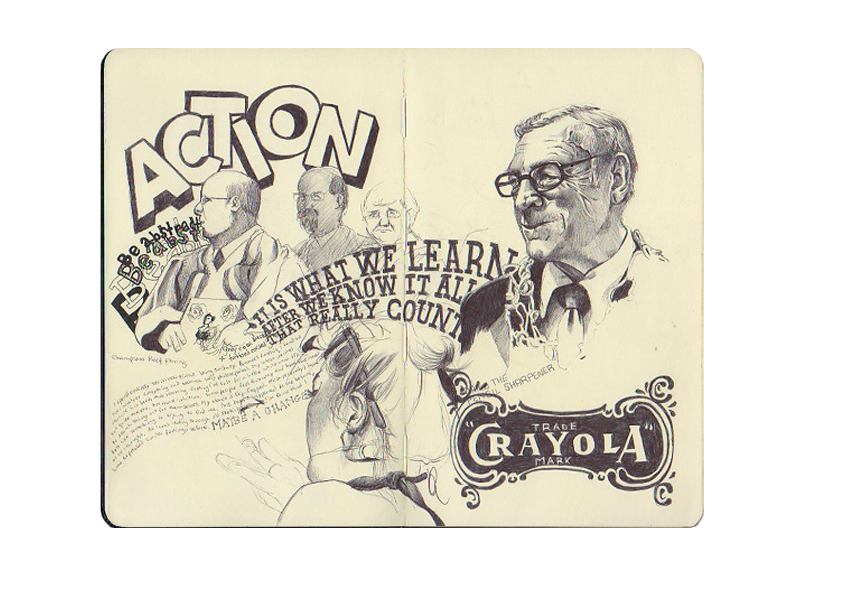
Creating a system of communication using the language of my sketchbooks is the most unique way to create an authentic product in regards to the SSPP. Using elements such as hand-drawn typography, loose portraiture and overlapping layouts will be a reflection of how I process information and make design-based decisions.
The final product will not necessarily look like the pages of my sketchbook; however, there will be a similar mood and energy reflected. The final product will look more or less like an editorial illustration--finished with paint and computer manipulation. The size of the display panel will allow myself to work large and spend a large portion of time painting like a traditional illustrator. This may actually be the largest illustration that I've ever attempted and I think this is the perfect way to end my time at VIU.

Feb 28, 2012

SSPP: User-Testing


THE FOCUS
Let me start off by saying that my final project does not follow the criteria put forward in the course curriculum for ARTG 480. I am not blatantly avoiding the milestones and preparatory work that needs to be completed, but my efforts and timeline are slightly different. And I'll tell you why.

I began working on my final project for ARTG 480 two years ago knowing that this would be my final academic project. I wanted to pursue something that would challenge my skills as a communicator of information. I dedicated myself for over a year to accumulate data on a day-to-day basis in order to create an understanding of my behaviors as an artist, designer, student, employee and individual. The results are intended to be definitive and detailed, based on fact instead of interpretation.

The major difference between this project and the course curriculum is that the deliverables of the Statistical Self-Portrait Project (SSPP) will be determined by the synthesis of the accumulated data and the application of user feedback. The series of diagrams within this post provide user feedback answers to questions intended to establish the SSPP deliverables.

THE OUTCOME
The user feedback has been helpful to establish how the results of my study should be presented, which uphold the integrity of the study and also my creative voice as an artist. Most importantly, the feedback has determined the most appropriate media, medium and aesthetic to communicate the project results. Initially I was intending to create a series of computer-generated info-graphics. This would be a suitable solution; however, the end result does not speak to my voice and style as an artist. To appease my creative soul I have decided to add traditional illustration to the series of info-graphics to create a hybrid style emphasizing personal style, interpretation and originality.

Feb 18, 2012

SSPP: Time sheet Pictographs

A series of 13 pictographic calendars were used to gauge my time spent on day-to-day activities. Each pictograph is represented as a month composed of 96 fifteen-minute periods accumulating into an entire 24-hour day. A series of nine icons represent the basic day-to-day activities, as follows:
The physical act of time tracking was a difficult concept to add to my lifestyle. I always had to be aware of what I was doing and when I was doing it. After the first few weeks the task became routine and my memory began to improve. I would be able to remember activities and there time spans, and be able to record them approximately three hours afterwards.

Feb 17, 2012

SSPP: The Inspiration

During the summer of 2008 I was an intern at Generator Strategy Advertising and Design. At the time I was an Illustration student at Sheridan, so my primary responsibilities were illustrating and story-boarding. I didn't necessarily understand how I would fit in with the staff of designers, editors, account managers and administration. To my surprise I learned that every employee was expected to keep time sheets of their daily activities. I found this idea fascinating because I've always been interested in personal documentation; however, my previous experience included journaling, blogging and keeping a sketchbook.

Skip ahead three years later, and I have graduated from Sheridan's Illustration program and have moved out west to Vancouver Island, British Columbia to study Graphic Design at Vancouver Island University. Being a recent graduate and new student simultaneously made me feel very motivated to work. I began undertaking small personal projects to stimulate my creativity. At one point I remember being very self-aware of my current position in the grand scheme of my life and realized that I was stuck in an academic-like limbo for another two years. It was an unsettling feeling, so I thought I would brainstorm ways to make my time feel less petty and more significant. I began doing things like journaling, blogging and keeping a photo-journal that I dedicated myself to, but I found that my dedication was slowly dissipating. I was trying really hard to find something to dedicate myself to over a long period of time that would capture my interest. To satisfy my ego I needed to challenge myself in a way I have never done before.

I decided if I was going to make really good work and stand out from the crowd, then I needed to understand how to maximize my efforts. This realization led me to create a system of time tracking that would be implemented within my life for an entire year. The time sheets I once used as an intern would be the basis of the longest and most in- depth research that I have ever attempted.

From September 10, 2010 to September 9, 2011 I documented every activity I did during the year using a pictographic calendar. The study is named the Statistical Self-Portrait Project (SSPP) and its purpose is to provide statistical analysis of how I spent my time during the year of documentation. By doing this I will be able to understand my strengths and weaknesses, and how to apply myself in all aspects of my life to reach the highest possible standard of living.